Promote a sustainable society and environment
Connection hours of video conferencing
| 2015 | |
|---|---|
| CNP Assurances (France) | 8,247 |
| MFPrévoyance (France) | 0 |
| LBP Prévoyance (France) | 0 |
| Caixa Seguradora (Brazil) | 3,032 |
| CNP CIH (Cyprus/Greece) | 122 |
| CNP Partners (Spain) | 230 |
| CNP UniCredit Vita (Italy) | 76 |
| CNP Argentine (Argentina) | 35 |
| CNP Europe Life (Ireland) | 0 |
| TOTAL | 11,742 |
Air travel
| 2011 | 2012 | 2013 | 2014 | 2015 | |
|---|---|---|---|---|---|
| CNP Assurances (France) | 4.30 | 3.30 | 2.73 | 3.48 | 3.20 |
| MFPrévoyance (France) | n/a | 0.01 | 0.01 | 0.01 | 0.01 |
| LBP Prévoyance (France) | n/a | 0.08 | 0.08 | 0.08 | 0.07 |
| Caixa Seguradora (Brazil) | 6.09 | 8.48 | 7.99 | 8.91 | 11.2 |
| CNP CIH (Cyprus/Greece) | 0.26 | 0.30 | 0.40 | 0.29 | 0.29 |
| CNP Partners (Spain) | 0.75 | 0.65 | 0.51 | 0.52 | 0.44 |
| CNP UniCredit Vita (Italy) | 0.72 | 0.13 | 0.24 | 0.18 | 0.13 |
| CNP Argentine (Argentina) | 0.05 | 0.06 | 0.05 | 0.25 | 0.20 |
| CNP Europe Life (Ireland) | 0.07 | 0.08 | 0.10 | 0.08 | 0.05 |
| TOTAL | 12.2 | 13.4 | 12.3 | 13.90 | 15.55 |
Car travel
| 2011 | 2012 | 2013 | 2014 | 2015 | |
|---|---|---|---|---|---|
| CNP Assurances (France) | n/a | n/a | n/a | n/a | 9.4 |
| MFPrévoyance (France) | n/a | 0.06 | 0.06 | 0.05 | 0.04 |
| LBP Prévoyance (France) | n/a | 0.13 | 0.15 | 0.26 | 0.18 |
| Caixa Seguradora (Brazil) | 0.2 | 0.11 | 0.1 | 0.1 | 0.12 |
| CNP CIH (Cyprus/Greece) | 0.42 | 0.34 | n/a | n/a | n/a |
| CNP Partners (Spain) | 0.19 | 0.21 | 0.31 | 0.36 | 0.39 |
| CNP UniCredit Vita (Italy) | n/a | n/a | n/a | 0 | 0 |
| CNP Argentine (Argentina) | 0.17 | 0.13 | 0.1 | 0.11 | 0.065 |
| TOTAL | 0.98 | 0.98 | 0.72 | 0.88 | 10.2 |
Use of consumables for internal purposes
Paper use for internal purposes
| In millions of sheets | Percentage of recycled paper | |
|---|---|---|
| CNP Assurances (France) | 22.2 | 23.9% |
| MFPrévoyance (France) | 0.3 | 0% |
| LBP Prévoyance (France) | 0.2 | nc |
| Caixa Seguradora (Brazil) | 1.1 | 0% |
| CNP CIH (Cyprus/Greece) * | 6.3 | 0% |
| CNP Partners (Spain) | 1.1 | 0% |
| CNP UniCredit Vita (Italy) | 0.9 | 100% |
| CNP Argentine (Argentina) | 0.5 | 10% |
| CNP Europe Life (Ireland) | 0.03 | 100% |
| TOTAL | 32.6 | 19.4% |
* Including paper used by CNP CIH agents
Computer consumables (number of cartidges)
| 2011 | 2012 | 2013 | 2014 | 2015 | |
|---|---|---|---|---|---|
| CNP Assurances (France) | 7,572 | 8,288 | 7,860 | 6,151 | 6,919 |
| MFPrévoyance (France) | n/a | n/a | n/a | 64 | 106 |
| LBP Prévoyance (France) | n/a | 79 | 84 | 80 | 72 |
| Caixa Seguradora (Brazil) | 594 | 406 | n/a | n/a | n/a |
| CNP Partners (Spain) | 120 | 80 | 110 | 115 | 166 |
| CNP UniCredit Vita (Italy) | n/a | 135 | 145 | 128 | 91 |
| CNP Argentine (Argentina) | 40 | 48 | n/a | 180 | 120 |
| CNP Europe Life (Ireland) | 9 | 12 | 14 | 13 | 11 |
| TOTAL | 8,335 | 9,048 | 8,213 | 6,731 | 7,485 |
Electricity
| 2011 | 2012 | 2013 | 2014 | 2015 | |
|---|---|---|---|---|---|
| CNP Assurances (France) | 17.5 | 18 | 18.34 | 16.93 | 17.70 |
| MFPrévoyance (France) | n/a | 0.35 | 0.36 | 0.30 | 0.29 |
| LBP Prévoyance (France) | n/a | 0.09 | 0.07 | 0.09 | 0.14 |
| Caixa Seguradora (Brazil) | 1.19 | 1.32 | 1.19 | 1.61 | 1.22 |
| CNP CIH (Cyprus/Greece) | 0.33 | 0.34 | 1.36 | 1.52 | 1.50 |
| CNP Partners (Spain) | 0.25 | 0.31 | 0.31 | 0.30 | 0.28 |
| CNP Santander (Ireland) | - | - | - | - | 0.05 |
| CNP UniCredit Vita (Italy) | 0.08 | 0.63 | 0.67 | 0.61 | 0.75 |
| CNP Argentine (Argentina) | 0.14 | 0.15 | 0.15 | 0.15 | 0.13 |
| TOTAL | 19.5 | 21.2 | 22.5 | 21.6 | 22.07 |
District heating system use by CNP Assurances (million kWh)
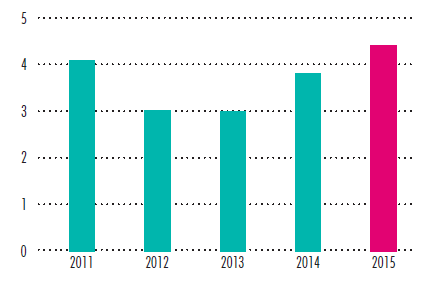
- 2011 : 4,1 Kw/h
- 2012 : 3 Kw/h
- 2014 : 3,8 Kw/h
- 2015 : 4,4 Kw/h
Water use (in thousands of cubic meters)
| 2011 | 2012 | 2013 | 2014 | 2015 | |
|---|---|---|---|---|---|
| CNP Assurances (France) | 45.8 | 43.5 | 41.1 | 32.9 | 27.7 |
| MFPrévoyance (France) | n/a | 0.8 | 0.8 | 0.9 | 0.9 |
| LBP Prévoyance (France) | n/a | 0.4 | 0.4 | 0.4 | 0.4 |
| Caixa Seguradora (Brazil) | 33.5 | 35.5 | 39.9 | 28.2 | 24.3 |
| CNP CIH (Cyprus/Greece) * | - | - | - | 2.9 | 3.0 |
| CNP Partners (Spain) | 0.6 | 0.7 | 0.9 | 1.5 | 1.7 |
| CNP UniCredit Vita (Italy) | 1.8 | 1.5 | 3 | 3.2 | 3.6 |
| CNP Argentine (Argentina) | 1.9 | 1.7 | 1.8 | 1.8 | 1.5 |
| TOTAL | 83.9 | 84.2 | 88.2 | 71.9 | 63.2 |
Business paper use
|
in millions of sheets |
Proportion of paper certified environmentally sustainable | |
|---|---|---|
| CNP Assurances (France) * | 103.4 | 99.96% |
| MFPrévoyance (France) | 0.8 | 100% |
| Caixa Seguradora (Brazil) | 4.8 | 100% |
| CNP CIH (Cyprus/Greece) | 2.6 | 0% |
| CNP Partners (Spain) | 0.2 | 0% |
| CNP UniCredit Vita (Italy) | 4.5 | 100% |
| CNP Argentine (Argentina) | 0.2 | 0% |
| CNP Europe Life (Ireland) | 0.008 | 100% |
| TOTAL | 116.5 | 89.4% |
* Including corporate brochures
CNP Assurances Group’s partial greenhouse gas emissions
As part of the CSR approach, we decided to consolidate the results of our GHG emissions audits for all of our consolidated subsidiaries. Since 2013, the consolidated assessment is based on data available from existing environmental reporting and covers the main emissions sources: electricity, gas, heating oil, paper for internal operations, waste and business travel. It does not cover refrigerant gases (minor in terms of emissions), purchases of services, freight (minor in terms of emissions), commuting and visitors. It is carried out using the Bilan Carbone® method and the ADEME carbon database.
In 2015, the Group’s partial GHG emissions stood at 9,980 t.CO2 eq., representing an average of 2.10 t.CO2 eq. for each of its 4,740 employees. The biggest emissions sources were business travel by plane (4,130 t.CO2 eq.) and energy use (3,250 t.CO2 eq.).
Breakdown of greenhouse gas emissions CNP Assurances Group
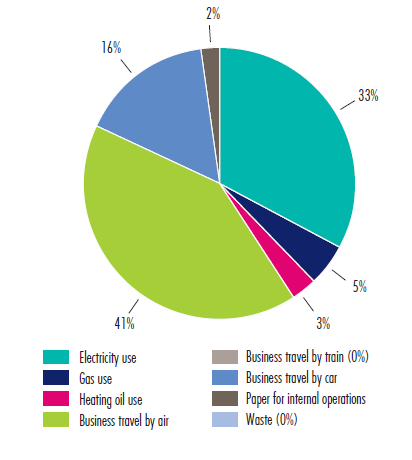
- Electricity use : 33%
- Gas use : 5%
- Heating oil use : 3%
- Business travel by air : 41%
- Business travel by train : 0%
- Business travel by car : 16%
- Paper for internal operations: 2%
- Waste : 0%